
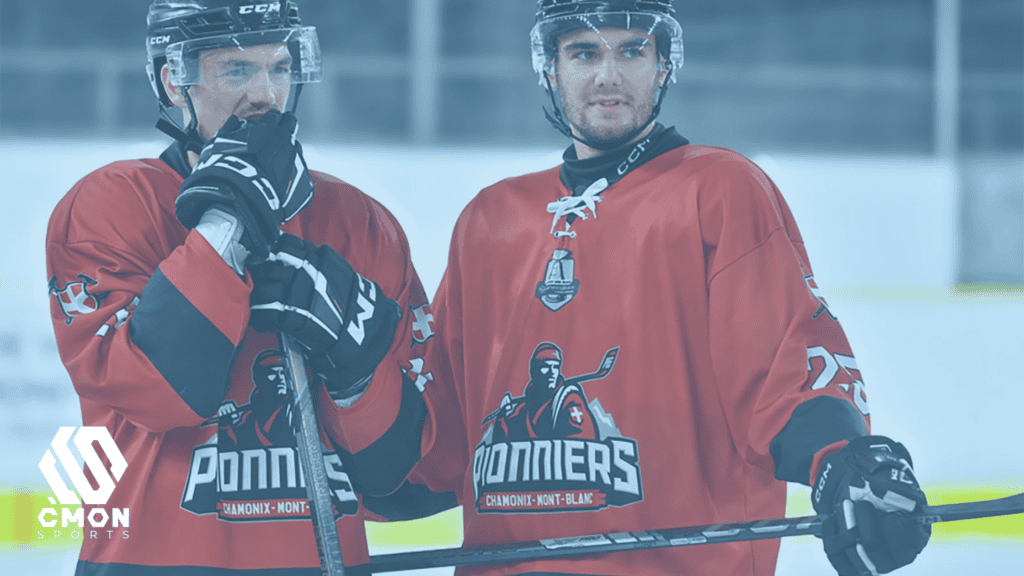
At the foot of Mont-Blanc, a club with more than a century of ice hockey heritage just rewrote what’s possible for mid-size European sports organizations. In a single Synerglace Ligue Magnus season, the Pionniers de Chamonix turned a fragmented stack of fan data into a measurable, monetisable engagement engine — and grew ticketing revenue by +20.4%.
This is the story of how a 2,000-seat arena at the foot of the Alps became one of the most disciplined fan engagement operations in French ice hockey. And why it matters for every club, league, and federation still treating fan data as an afterthought.
The starting point: rich tradition, fragmented data
The Pionniers de Chamonix have skated under the same red jersey for more than a century. They’ve shaped generations of local players and built one of the most loyal fanbases in French ice hockey’s top tier — the Synerglace Ligue Magnus.
But before the partnership with C’mon Sports, the club faced a paradox familiar to most mid-size European sports organizations: the passion was strong, the structure wasn’t.
Fan data lived in silos. The SULF ticketing platform held purchase records but didn’t talk to anything else. Social media posts went out without an editorial calendar. The website collected newsletter signups that nobody segmented. There was no engagement scoring, no automation, no shared methodology for measuring digital maturity. Marketing was a sprint between match days, not a season-long operation.
The club didn’t need another CRM tool. It needed an operating system for fan intelligence.
A new operating system for fan engagement
C’mon Sports stepped in as the Pionniers’ outsourced CRM and data department, deploying the full Data Factory model across four sequential phases. The principle was simple: stop chasing tools, start building structure.
Phase 1 — Measuring digital maturity with DMOS
Before activating anything, the team ran a comprehensive DMOS audit — Data Marketing Operating System — across nine pillars of digital maturity, from data architecture and acquisition to segmentation, monetisation, governance, and team capability.
The audit produced something the club had never had: a baseline. A clear, prioritised roadmap that told the marketing team exactly where to invest the next twelve months — and what to expect in return.
Phase 2 — Building the Data Factory
With the baseline in place, the CRM infrastructure was built on Arenametrix. The SULF ticketing feed was synced. GA4 was integrated to track website behaviour. The fan database was cleaned, structured, and made segmentation-ready.
Then came the automations — fourteen of them, deployed across the fan lifecycle:
- Welcome journeys for new contacts
- Birthday touchpoints tied to ticketing offers
- Engagement scoring that updated in real time
- Reactivation flows for dormant fans
- Match-day sequences for every home game
For the first time, every fan interaction left a trace. And every trace fed a decision.
Phase 3 — Engaging fans across an entire season
With the infrastructure live, the club shifted into operational mode. Monthly newsletters went out to segmented audiences. Each home game — regular season, playoffs, and playdowns — triggered its own match-day communication sequence: pre-game ticketing pushes, programme reveals, and post-game recaps. Competition forms captured first-party data during big events. An editorial calendar replaced reactive posting.
Nine newsletters were delivered across the season. Match-day sequences ran on autopilot. The marketing team finally had time to think strategically instead of putting out fires.
Phase 4 — Turning data into revenue
By mid-season, the conversation shifted from operations to intelligence. Quarterly performance reports surfaced the patterns hiding in the numbers. A sponsorship intelligence dashboard gave commercial teams something concrete to walk into meetings with. A comprehensive ticketing pricing analysis re-shaped the club’s commercial strategy for the season ahead.
Fan data stopped being a marketing asset. It became a board-level conversation.
Read the full Pionniers de Chamonix case study
The full case study walks through the methodology, the timeline, and the numbers in detail including the exact automation stack, the DMOS scoring across nine pillars, and the commercial roadmap that turned a heritage club into a data-driven fan engagement powerhouse.
👉 Download the Chamonix Pionniers case study
Want the same kind of transformation for your organization?
Whether you run a club, a league, or a federation, the starting point is the same: measure where you are. Our DMOS audit gives you a clear, structured baseline of your digital maturity across nine pillars — and a prioritised roadmap to monetisable fan engagement.
👉 Talk to our team to scope a transformation that fits your organization.
FAQ
DMOS stands for Data Marketing Operating System. It's a structured audit that scores a sports organization's digital maturity across nine pillars — data architecture, acquisition, engagement, segmentation, monetisation, analytics, governance, technology, and team capability. The output is a baseline score and a prioritised transformation roadmap. Learn more about the DMOS audit.
The Data Factory is C'mon Sports' operational data infrastructure — an outsourced CRM/CDP department, not just a tool implementation. It handles data ecosystem integration, workflow automation, audience segmentation, ongoing analytics, and monetisation optimisation. A traditional CRM project ends at go-live; the Data Factory runs the operation season after season.
A full ice hockey season — about 12 months end-to-end, sequenced across four phases: DMOS audit and foundation, Data Factory build, full-season fan engagement, and intelligence and revenue. The CRM and first automations were live within the early months, with monthly newsletters and match-day sequences running from kickoff onwards.


